Problem:
Extreme Switch reagiert sehr langsam, z.B. die Konsole. Das SNMP antwortet von Zeit zu zeit nicht.Es besteht der Verdacht, dass der Switch wodurch auch immer ausgebremst wird.
Der erste Blick galt dem top-Befehl, um sich die Prozesse anzuschauen. Der Spitzenreiter war mit 45,3% der bcmRX Prozess.
Google liefert dazu dies:
https://community.extremenetworks.com/extreme/topics/8810_bcmrx_40_60_cpu_utilization-6zzlz
oder
https://community.extremenetworks.com/extreme/topics/high-bcmrx-process-in-black-diamonds
Es besteht der Verdacht auf einen Loop.
CPU: 13.3% usr 40.5% sys  0.0% nic 22.0% idle  0.0% io 11.3% irq 12.7% sirq
Load average: 12.86 11.37 10.98 7/187 6070
  PID  PPID USER     STAT   RSS %MEM CPU %CPU COMMAND
 1344     2 root     RW       0  0.0   1 45.3 [bcmRX]
 1502     1 root     S     4440  0.4   0  5.8 ./snmpSubagent
 1675     2 root     RW<      0  0.0   1  5.4 [bcmL2X.1]
 1492     1 root     S <  19036  1.8   0  4.6 ./hal
 1500     1 root     S     7600  0.7   0  3.8 ./snmpMaster
 1799     2 root     SW<      0  0.0   1  2.0 [bcmCNTR.1]
 1508     1 root     S     3672  0.3   0  1.5 ./vlan
 1797     1 root     R      716  0.0   0  1.5 ./exsshd
 1498     1 root     R     3140  0.3   0  1.3 ./cfgmgr
 1287     2 root     RW<      0  0.0   1  1.0 [bcmLINK.1]
 1670     2 root     SW<      0  0.0   0  1.0 [bcmL2X.0]
 6070  6069 root     R      832  0.0   0  0.9 top -d 3
 1798     2 root     SW<      0  0.0   0  0.7 [bcmCNTR.0]
 1490     1 root     S     2180  0.2   0  0.4 ./devmgr
 1284     2 root     SW<      0  0.0   0  0.4 [bcmLINK.0]
 1672     2 root     SWN      0  0.0   0  0.3 [bcmL2XAGE.0]
 1595     1 root     S     3000  0.2   0  0.1 ./acl
 1126     1 root     S     2668  0.2   0  0.1 /exos/bin/epm -t 40 -f /exos/config/epmrc.Edge -d /exos/config/epmdprc
 1534     1 root     S     2628  0.2   0  0.1 ./lacp
 1577     1 root     S     2464  0.2   0  0.1 ./rip
 1514     1 root     S     2164  0.2   0  0.1 ./elrp
Zur Fehlersuche wird der Befehl sh l2stats genutzt, der Anzahl von Paketen in bestimmten VLANs anzeigen kann.
Slot-1 EX-AC.1 # sh l2stats
 Bridge interface on VLAN Default:
 Total number of packets to CPU = 0.
 Total number of packets learned = 0.
 Total number of IGMP control packets snooped = 0.
 Total number of IGMP data packets switched = 0.
 Total number of MLD control packets snooped = 0.
 Total number of MLD data packets switched = 0.
Bridge interface on VLAN Mgmt:
 Total number of packets to CPU = 8676926.
 Total number of packets learned = 0.
 Total number of IGMP control packets snooped = 0.
 Total number of IGMP data packets switched = 0.
 Total number of MLD control packets snooped = 0.
 Total number of MLD data packets switched = 0.
Bridge interface on VLAN V0351:
 Total number of packets to CPU = 2987171601.
 Total number of packets learned = 52972537.
 Total number of IGMP control packets snooped = 0.
 Total number of IGMP data packets switched = 569.
 Total number of MLD control packets snooped = 0.
 Total number of MLD data packets switched = 0.
Das VLAN V0351 verursacht bestimmt das Problem und seine Konfig wird genau untersucht.
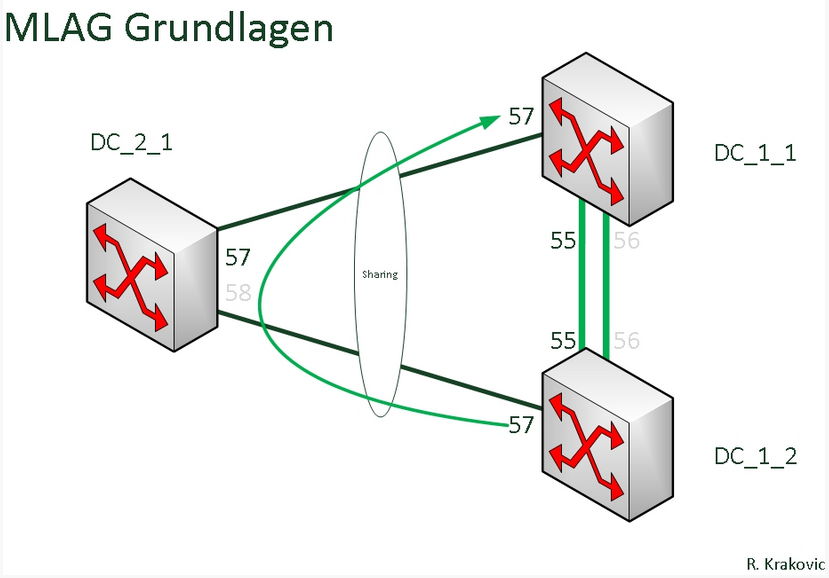
Nach einer gründlichen Untersuchung stellte man fest, dass ein die MLAG Verbindung zwischen dem beiden Core-Switches und dem Palo Alto Firewall nicht sauber konfiguriert war.
Eine schöne Info zur MLAG Konfig findet man bei mir im Blog.
Diese Änderung führte tatsächlich dazu, dass Pakete beim Core-Switch durch den Prozessor gejagt wurden, wie auch immer einen Loop verursacht haben, ohne dass dies als klassischer Loop im VLAN mit einem gesperrten Port erkannt wurde.
So sieht die Auschrift von „top“ auf der Konsole des Extreme Switches jetzt:
Mem: 539660K used, 481852K free, 0K shrd, 135020K buff, 147484K cached
CPU:  8.3% usr 11.1% sys  0.0% nic 77.7% idle  0.0% io  2.1% irq  0.4% sirq
Load average: 9.23 8.33 8.28 4/187 9377
  PID  PPID USER     STAT   RSS %MEM CPU %CPU COMMAND
 1502     1 root     S     4440  0.4   1  4.9 ./snmpSubagent
 1492     1 root     S <  19104  1.8   1  3.4 ./hal
 1500     1 root     S    11268  1.1   1  2.1 ./snmpMaster
 1799     2 root     SW<      0  0.0   1  1.4 [bcmCNTR.1]
 1287     2 root     SW<      0  0.0   1  1.1 [bcmLINK.1]
 1798     2 root     SW<      0  0.0   0  1.1 [bcmCNTR.0]
 1284     2 root     SW<      0  0.0   0  0.9 [bcmLINK.0]
 1498     1 root     S     3144  0.3   1  0.6 ./cfgmgr
 9377  9376 root     R      832  0.0   0  0.6 top -d 3
 1490     1 root     S     2180  0.2   1  0.4 ./devmgr
 1573     1 root     S     2132  0.2   0  0.4 ./bfd
 1508     1 root     S     3676  0.3   1  0.3 ./vlan
 1577     1 root     S     2464  0.2   1  0.3 ./rip
 1494     1 root     S     1692  0.1   1  0.3 ./nodemgr
 1344     2 root     SW       0  0.0   1  0.3 [bcmRX]
 1614     1 root     S     8264  0.8   0  0.1 ./etmon
 1595     1 root     S     3004  0.2   0  0.1 ./acl
Der Prozess bcmRZ nimmt sich nun 0.3 Prozent der Prozessorleistung und alles ist wieder schön.
Hier noch einmal zusammenfassend, wozu diese MLAG Falschkonfiguration geführt hatte:
- Alles funktioniert, alle PINGs antworten.
- Ab und zu antwortete der Core-Switch auf SNMP anfragen nicht.
- Der Datendurchsatz in diesem VLAN war nur in einer Richtung sehr schlecht
- Die Switch-Konsole reagiert nur träge