https://www.paessler.com/de/prtg/prtg-network-monitor
Problem:
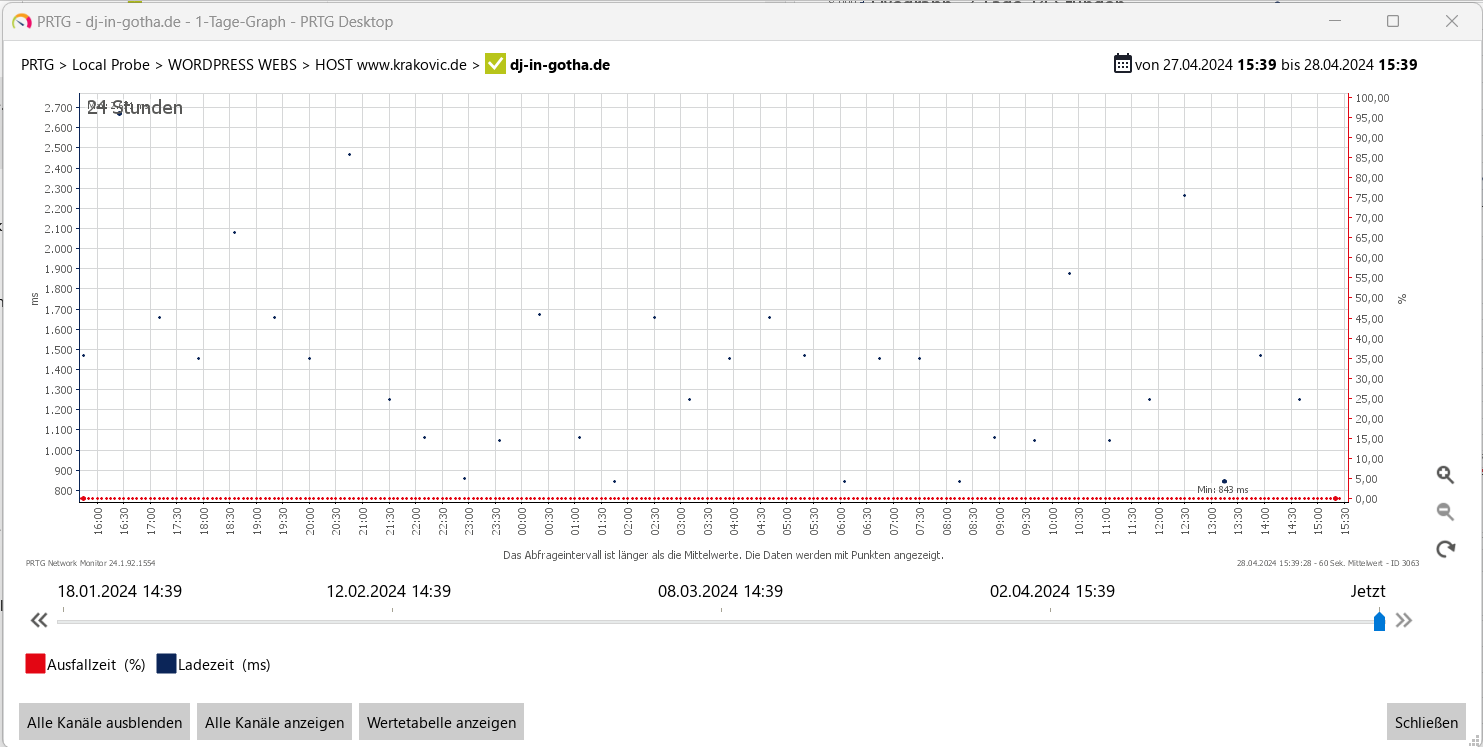
In den Grafen werden die Werte als Punkte anstatt als verbundene Balken dargestellt. In der Information unter dem Grafen steht folgender Text:
Das Abfrageintervall ist länger als die Mittelwerte.
Die Daten werden mit Punkten dargestellt.
Problemlösung:
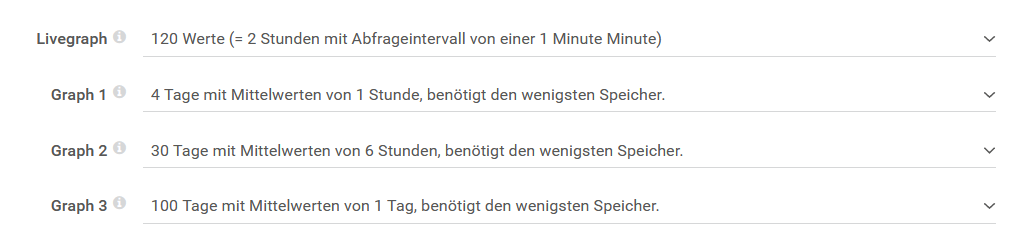
Unter KONFIGURATION > SYSTEMVERWALTUNG > WEBINTERFACE finden man unten den Abschnitt Einstellungen für Graphen.
Hier sollte man eine Einstellung wählen, die den mindesten Speicher benötigt. so hat es zumindest bei mir funktioniert:
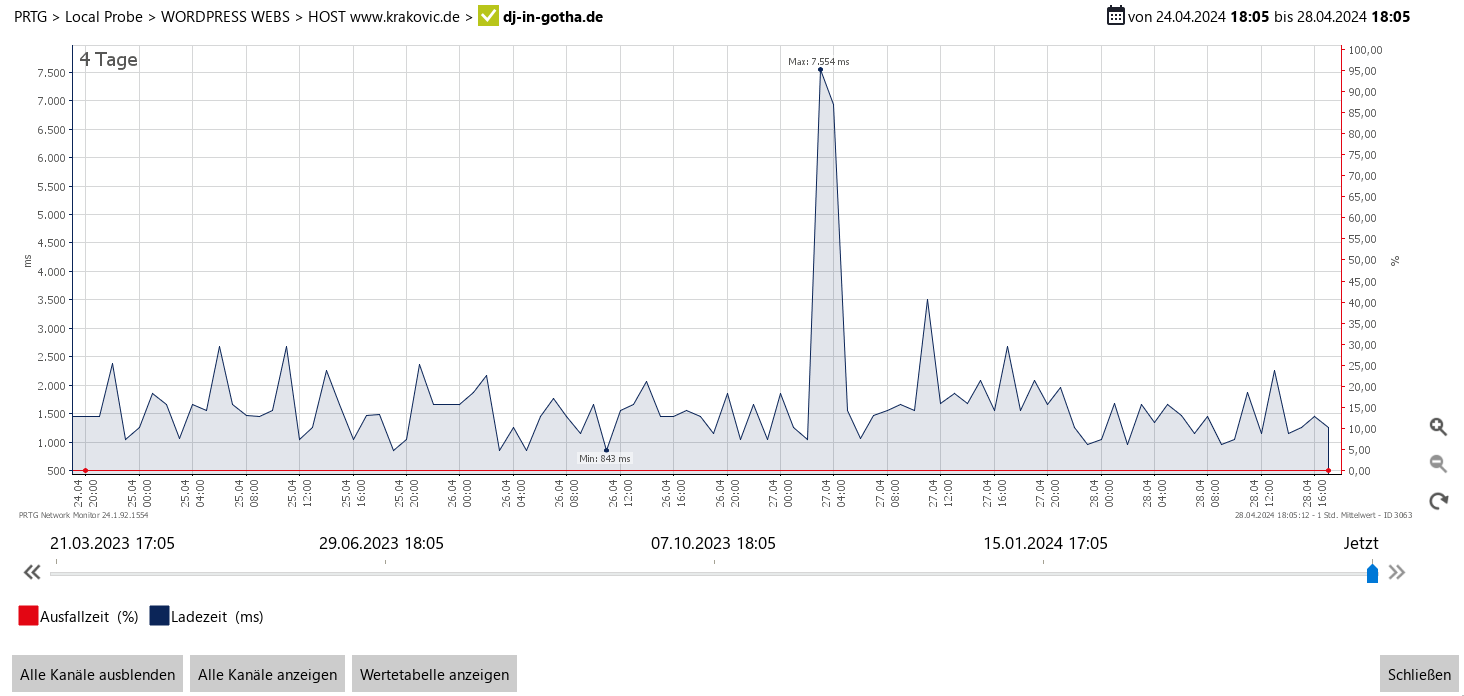
Nach dem Neustart werden die Daten neu berechnet und wieder als eine schöne Kurve dargestellt.
Hier ist der Text aus der Hilfe:
Graph Settings
PRTG shows several graphs on the Overview tabs and x Days tabs of objects in the PRTG web interface. PRTG keeps these in RAM for fast graph display. The longer the time frames and the shorter the intervals are, the more memory PRTG uses for this. You can adapt the details for all four graphs. This setting also changes the caption of the graphs and tabs in the PRTG web interface and thePRTG app for desktop.
 If you change this setting, PRTG needs to restart the PRTG core server to apply your changes. After you click Save, a dialog box appears that asks you to confirm the restart. Click OK to trigger the restart. During the restart, all users of the PRTG web interface, the PRTG app for desktop, or the PRTG Apps for Mobile Network Monitoring are disconnected and reconnected.

Graph Settings
|
|
|
|
Live Graph
|
 The live graph is only available for sensors. The live graph is only available for sensors.
The live graph does not have a fixed time span but you can define how many values to display. The actual time span that the live graph covers depends on the scanning interval of the sensor that you view. PRTG automatically calculates the time span. The default is 120 Values. This results in a graph that covers a time span of two hours if a sensor has a 1-minute scanning interval. Other scanning intervals result in graphs that cover different time spans.
- 60 values: Cover a time span of one hour if a sensor has a scanning interval of one minute.
This setting uses the least amount of RAM. We recommend this setting for installations with 10,000 sensors or more.
- 120 values: Cover a time span of two hours if a sensor has a scanning interval of one minute.
- 240 values: Cover a time span of four hours if a sensor has a scanning interval of one minute.
- 480 values: Cover a time span of eight hours if a sensor has a scanning interval of one minute.
- 960 values: Cover a time span of 16 hours if sensor has a scanning interval of one minute.
This setting uses the most amount of RAM.
|
|
Graph 1
|
By default, this is the 2 days graph in the PRTG web interface. You can change it to have more or less detail. PRTG averages the monitoring results of the actual scanning intervals of the sensors.
- 1 day with averages of 1 minute: Cover a time span of one day with averages of one minute. This results in 1440 values.
- 1 day with averages of 5 minutes: Cover a time span of one day with averages of five minutes. This results in 288 values.
- 1 day with averages of 15 minutes: Cover a time span of one day with averages of 15 minutes. This results in 96 values.
This setting uses the least amount of RAM. We recommend this setting for installations with 10,000 sensors or more.
- 2 days with averages of 1 minute : Cover a time span of two days with averages of one minute. This results in 2880 values.
This setting uses the most amount of RAM.
- 2 days with averages of 5 minutes: Cover a time span of two days with averages of five minutes. This results in 576 values.
- 2 days with averages of 15 minutes: Cover a time span of two days with averages of 15 minutes. This results in 192 values.
- 4 days with averages of 1 hour: Cover a time span of two days with averages of one hour. This results in 96 values.
This setting uses the least amount of RAM. We recommend this setting for installations with 10,000 sensors or more.
|
|
Graph 2
|
By default, this is the 30 days graph in the PRTG web interface. You can change it to have more or less detail.
- 10 days with averages of 1 hour: Cover a time span of 10 days with averages of one hour. This results in 240 values.
- 20 days with averages of 1 hour: Cover a time span of 20 days with averages of one hour. This results in 480 values.
- 30 days with averages of 1 hour: Cover a time span of 30 days with averages of one hour. This results in 720 values.
- 30 days with averages of 6 hours: Cover a time span of 30 days with averages of six hours. This results in 120 values.
This setting uses the least amount of RAM. We recommend this setting for installations with 10,000 sensors or more.
- 40 days with averages of 1 hour: Cover a time span of 40 days with averages of one hour. This results in 960 values.
- 40 days with averages of 6 hours: Cover a time span of 40 days with averages of six hours. This results in 160 values.
- 60 days with averages of 1 hour: Cover a time span of 60 days with averages of one hour. This results in 1440 values.
This setting uses the most amount of RAM.
- 60 days with 6 hour averages of 6 hours: Cover a time span of 60 days with averages of six hours. This results in 240 values.
|
|
Graph 3
|
By default, this is the 365 days graph in the PRTG web interface. You can change it to more or less detail by choosing a time span covered and a monitoring interval average associated with it.
- 100 days with averages of 1 day: Cover a time span of 100 days with averages of one day. This results in 100 values.
This setting uses the least amount of RAM. We recommend this setting for installations with 10,000 sensors or more.
- 200 days with averages of 1 day: Cover a time span of 200 days with averages of one day. This results in 200 values.
- 365 days with averages of 1 day: Cover a time span of 365 days with averages of one day. This results in 365 values.
- 400 days with averages of 1 day: Cover a time span of 400 days with averages of one day. This results in 400 values.
- 750 days with averages of 1 day: Cover a time span of 750 days with averages of one day. This results in 750 values.
This setting uses the most amount of RAM.
|
